California’s Budget
California and more specifically its growing government budget has been in the news frequently of late and I thought I would just dig into the numbers presenting them factually without the commentary. California is not being singled out for criticism; as the world’s fourth-largest economy with substantial resources, it provides a useful starting point for examining state budgets and how public funds are allocated.
We’ll start with the overall budget growth chart shown in inflation-adjusted dollars. Followed by a breakdown of the 2026-27 budget totals.
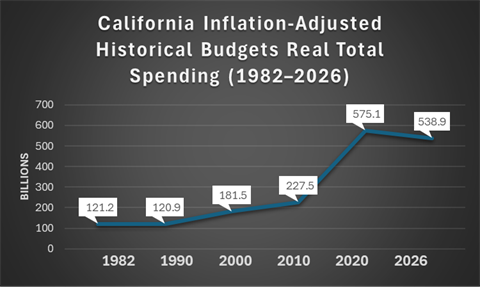
Breakdown of the $538.9 Billion Total (2026–27)
| Budget Layer | Amount (Billions) | What It Covers |
| State General Fund | $251.5B | The core operating budget (Income/Sales tax revenue) |
| State Special Funds | $95.2B | Earmarked money (e.g., DMV fees, gas taxes for roads) |
| State Bond Funds | $5.0B | Borrowed money for long-term infrastructure |
| State-Level Total | $351.7B | This is the official Enacted Budget figure. |
| Federal Funds | $187.2B | Federal matching dollars (mostly for Medi-Cal) |
| Grand Total Spending | $538.9B | This is the comprehensive historical trend figure. |
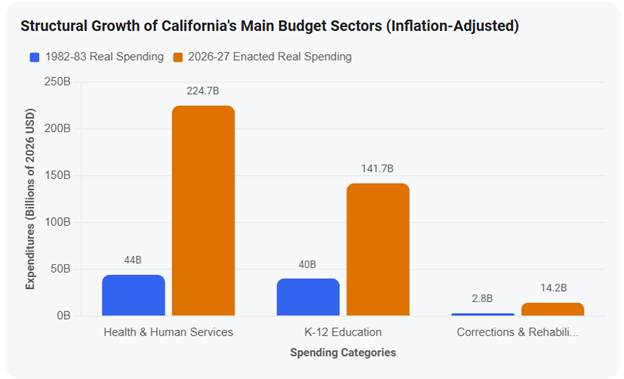
- Health Care (The #1 Driver): Health and Human Services has expanded almost 5x in real terms. This massive expansion is fueled by the explosive growth of Medi-Cal (California’s version of Medicaid). In 1985, roughly 1 in 10 Californians were on Medi-Cal; today, following the federal Affordable Care Act expansion and subsequent state-level eligibility additions (such as extending coverage to undocumented residents), it covers over 13 to 14 million people—more than one-third of the entire state populace. Total annual Medi-Cal costs alone now hover around $219.7 billion.
- TK-12 Education (The Protected Baseline): By law, K-12 education is shielded by Proposition 98, a voter-approved initiative passed in 1988 that requires roughly 40% of the state’s General Fund to be dedicated to schools. As state tax revenues skyrocketed over the decades, the Proposition 98 guarantee grew proportionally, bringing real TK-12 education spending from roughly $40 billion in 1982 to over $141 billion today. Spending per single student now sits at an all-time high of $21,129 per year.
- Corrections & Rehabilitation: There is a common misconception that prisons are a major contributor to the state’s recent budget crises. During the “tough-on-crime” era of 1980 to 2006, California’s prison budget did skyrocket as the incarcerated population soared past 160,000. However, following federal court mandates to reduce overcrowding, the prison population has fallen below 95,000. While the Department of Corrections (CDCR) budget stands at $14.2 billion for 2026–27, it now accounts for less than 4.1% of total state spending.
When evaluating California’s long-term spending surge in real, inflation-adjusted terms, Health and Human Services has been the overwhelming driver of expansion, followed closely by TK-12 Education. Conversely, while prison spending grew rapidly in the 1980s and 1990s, it has flatlined and even shrunk as a percentage of the total budget in recent years.
Today, roughly 3 out of every 4 dollars the state spends from its general and special funds are consumed by just three categories: health, education, and corrections.
The chart below displays how these major buckets have scaled up from 1982 to the 2026–27 enacted budget, converted into constant, inflation-adjusted 2026 dollars.
The chart on page 1 page shows a sharp rise in budget spending from 2010 to 2020 of almost 200 billion dollars. The year-by-year breakdown below identifies the primary driver of each increase, with further detail provided later in the report.
Breaking down the Budget Spike (2010-2026)
California State Budget: Total Expenditures (All Funds + Federal Dollars)
| Fiscal Year | Nominal Total Spending | Real Spending (Adjusted to 2026 Dollars) | Key Macro Driver |
| 2010–11 | $188.5 Billion | $279.0 Billion | ARRA (Federal Stimulus Act) funds peak to cushion recession gaps. |
| 2011–12 | $185.2 Billion | $266.7 Billion | Federal stimulus winds down; state drops to lowest real spending floor. |
| 2012–13 | $205.4 Billion | $291.7 Billion | Economic stabilization begins; revenues recover. |
| 2013–14 | $215.8 Billion | $300.0 Billion | Initial Medicaid (Medi-Cal) expansions under the Affordable Care Act. |
| 2014–15 | $252.6 Billion | $348.6 Billion | Massive influx of federal dollars as millions of residents enter Medi-Cal. |
| 2015–16 | $265.1 Billion | $360.5 Billion | Continued structural growth in health, human services, and K-12 education. |
| 2016–17 | $280.4 Billion | $372.9 Billion | Steady multi-year economic expansion phase. |
| 2017–18 | $298.5 Billion | $388.1 Billion | High capital gains collections push state funding higher alongside federal match rates. |
| 2018–19 | $315.2 Billion | $400.3 Billion | Reaches the $400B threshold in real terms prior to administration transitions. |
| 2019–20 | $342.8 Billion | $428.5 Billion | Historic pre-pandemic peak across education investments and local aid. |
| 2020–21 | $485.5 Billion | $592.3 Billion | Unprecedented $110B+ nominal spike driven by emergency pandemic response and initial CARES Act/ARP federal inflows. |
| 2021–22 | $442.2 Billion | $514.8 Billion | Massive state revenue surplus (“windfall”) masks tapering federal aid. |
| 2022–23 | $413.8 Billion | $452.9 Billion | Peak tech capital gains push ongoing commitments up right before the market drop. |
| 2023–24 | $452.7 Billion | $479.5 Billion | Income tax filing delays clash with revenue drop, triggering major structural deficits. |
| 2024–25 | $413.8 Billion | $426.2 Billion | Spending temporarily dips as the state uses reserve funds to cover gaps. |
| 2025–26 | $414.1 Billion | $419.8 Billion | Enacted cuts to baseline state functions while maintaining core safety nets. |
| 2026–27 | $539.7 Billion | $539.7 Billion | Record High Real Footprint: General Fund grows to $251.5B, masked heavily by complex structural borrowing and internal fund maneuvers. |
Key Drivers of the Budget Spike (listed without ranking by impact)
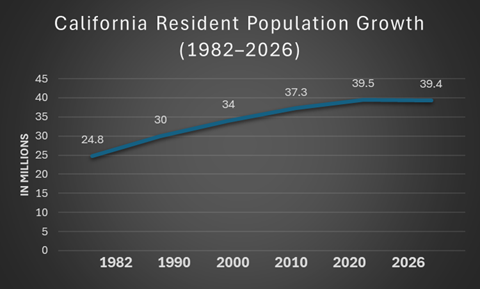
- Population Growth: California’s population grew by approximately 60% from 1982 to 2026, but has remained relatively flat since 2010. Population growth alone therefore does not explain the budget increase.
2. Permanently Expanded Entitlements
During the flush pandemic years, when California sat on a massive structural surplus, policymakers didn’t just allocate money to temporary relief. They permanently expanded foundational, long-term state programs:
Universal Medi-Cal: California became the first state to remove all immigration-status barriers for its low-income healthcare program, expanding access to adults aged 26 to 49. This structurally cemented tens of billions in recurring yearly expenditures into the Health & Human Services budget.
Transitional Kindergarten (TK): The state committed to building out a universal grade level for all four-year-olds, creating a permanent multi-billion-dollar funding obligation for local school districts.
3. Statutory Funding Formulas (Proposition 98)
Under California’s constitution, Proposition 98 mandates that a fixed percentage of General Fund revenues must go to K-14 education. Because revenues spiked so high in 2021 and 2022, the statutory minimum funding guarantee for schools locked in at record-high minimum floors. Even when the state faced subsequent deficits, unwinding these constitutionally mandated education outlays proved legally and politically difficult, resulting in the state deferring billions in internal loans rather than slashing school budgets.
4. Inflation and Cost-of-Living Adjustments
The same severe inflation that impacted consumer wallets also heavily expanded the state’s cost of doing business. State operational costs—ranging from multi-year infrastructure grants and concrete for transit to statutory cost-of-living adjustments (COLAs) built into public safety nets like CalWORKs—automatically climbed to match economic conditions. Additionally, the state committed to permanent baseline raises for university systems (such as UC and CSU) and state worker contracts to keep pace with the cost of living.
5. The Illusion of Balances (Budget Maneuvers)
Because California is constitutionally required to pass a “balanced budget” every year, it couldn’t run a traditional federal-style deficit when the tech boom turned into a revenue bust. Instead of severely cutting the expanded safety nets, the state utilized extensive accounting gimmicks, internal fund shifts, and borrowing against future years to keep the nominal spending baseline elevated. This created what state analysts call a compounding “wall of debt,” maintaining high structural spending despite lower real-time revenues.
Completing the picture of California’s Budget
Federal matching funds account for 34.7% of California’s total spending, including more than $187 billion that supports daily state operations. Yet California remains a net donor to the federal government: its residents and businesses pay roughly $275 billion more in federal taxes than the state receives in federal funding.
This Year’s Federal Funding Problem, Federal Funds Frozen.
Stripping away the political messaging, the legal filings, administrative notices, and state audit records establish the concrete facts behind why the federal government has frozen or deferred funding to California in 2026.
The actions trace back to three specific compliance, regulatory, and policy categories:
1. Commercial Trucker Licensing Dispute (DMV Integration)
- The Action: The U.S. Department of Transportation (DOT) withheld $160 million in federal highway safety and infrastructure funds from California.
- The Documented Reason: The Federal Motor Carrier Safety Administration (FMCSA) flagged 17,000 “non-domiciled” commercial driver’s licenses (CDLs) that California had issued to foreign-born drivers, refugees, and asylum seekers. Federal rules require these individuals to possess specific status documentation that the FMCSA stated was missing or invalid.
- The Trigger: The California DMV agreed to cancel the non-compliant licenses but pushed its internal deadline back by two months to complete the process. The federal government rejected the extension and froze the highway funds the day after the state missed the original January 5, 2026, deadline.
2. High-Risk Medicaid (Medi-Cal) Documentation Audits
- The Action: The Centers for Medicare & Medicaid Services (CMS) placed a temporary $867.5 million deferral on federal reimbursements to California’s Medicaid system.
- The Documented Reason: This is a regulatory “deferral,” not a permanent cut. CMS flagged rapid expenditure growth within California’s In-Home Supportive Services (IHSS) program—which provides home-care hours to roughly 900,000 low-income seniors and disabled individuals. Because California’s program growth heavily outpaced national spending trends, CMS designated the claims as “high-risk” under its standard fraud-and-waste mandates, pausing the payments until the state submits itemized billing and eligibility documentation to justify the spike.
3. Welfare & Child Care System Compliance Checks
- The Action: The Department of Health and Human Services (HHS) attempted to freeze $5 billion in family assistance grants allocated to California (affecting CalWORKs/TANF, the Child Care and Development Fund, and the Social Services Block Grant).
- The Documented Reason: HHS cited overarching “program integrity” and systemic fraud concerns within state-administered public welfare programs. To release the funds, the federal government demanded broad, individualized data tracking of program recipients to audit compliance.
- The Legal Status: A federal judge issued an injunction blocking this specific freeze. The court ruled that the federal government bypassed the legally required administrative processes and failed to provide sufficient evidence of widespread fraud to justify cutting off the funds. Data reviewed during the case showed that the vast majority of flagged welfare losses (such as EBT skimming) involved state and local funds rather than federal dollars.
4. Housing & Climate Grants Policy Adjustments
- The Action: Shifting federal guidelines slowed down hundreds of millions in expected funding for homelessness programs and green energy infrastructure.
- The Documented Reason:
- Homelessness (HUD): The Department of Housing and Urban Development adjusted its funding criteria for the Continuum of Care program. The new rules limit funding for permanent housing projects and redirect resources toward temporary shelters and sober-living programs, making California’s permanent-housing-first model ineligible for certain grants.
- Electric Vehicles (FHWA): The Federal Highway Administration restricted roughly $300 million in pre-approved funding meant for electric vehicle charging networks, shifting priorities under modified federal energy directives.
California’s Budget Report
This completes my attempt to provide a broad picture of California’s budget, its major programs, and the reasons spending rose rapidly over 16 years despite comparatively modest population growth. The state’s spending and budget decisions provide a clear view of its priorities. Regardless of one’s view of the policies and laws behind the budget’s growth, the figures offer a factual basis for evaluating them. The report concludes with a summary from the Legislative Analyst’s Office (LAO) budget findings.
Summarizing California’s Budget: Legislative Analyst’s Office (LAO) findings:
1. A Compounding “Budget Problem”
- The Deficit Estimate: The LAO calculates an $18 billion budget problem for the fiscal year. This is $5 billion larger than the shortfall anticipated by Governor Newsom’s administration.
- The Outyear Warning: Looking past the immediate horizon, the LAO projects that structural deficits will climb to roughly $35 billion annually starting in FY 2027–28. This is driven by an ongoing macroeconomic reality: state spending obligations are structurally outstripping baseline revenue growth.
2. The Illusion of Higher Revenues
On paper, California has seen strong personal income tax collections growing at The Formula Trap: Under California law, a massive chunk of any new revenue is immediately eaten up by constitutional minimum funding guarantees under Proposition 98 (K-14 school funding) and Proposition 2 (mandatory reserve deposits and debt pay-downs).
- The AI Bubble Risk: The LAO explicitly warns that the state’s current cash position is heavily inflated by stock market exuberance surrounding Artificial Intelligence (AI). The office advises lawmakers not to build ongoing permanent programs around this trend, noting that tech-heavy capital gains are historically volatile and highly prone to sharp market downturns.
3. The 70% Core Cost Problem
- In a public briefing regarding why the state is constantly forcing budget corrections despite high revenue, the LAO noted that roughly 70% of the General Fund growth is driven entirely by sustaining existing, previously made commitments. The structural cost of running expanded healthcare (Medi-Cal), social safety net infrastructure, and automatic cost-of-living adjustments limits the state’s flexibility to cut back when the economy cools down.
4. Over-Reliance on Internal Cash Borrowing
The LAO published a major critique titled “Understanding The State’s Astonishing Cash Position,” examining how California built a borrowable cash balance of over $100 billion.
- The Good News: Because the state has so much cash on hand internally, it has avoided needing to issue short-term Revenue Anticipation Notes (RANs) to Wall Street to pay its daily bills since 2011.
- The Bad News: The LAO warns that using this cash to essentially mask structural deficits via complex internal borrowing maneuvers carries serious long-term risks if a true economic recession hits.
Summary Advice to Lawmakers
The LAO is strongly advising the Legislature to adopt a defensive fiscal stance. They have pushed for the state to implement more than $10 billion in direct budget cuts or net revenue increases and to route cash into less flexible, dedicated rainy-day funds rather than relying on creative internal financing to balance the ledger.
Note: The LAO deliberately excludes temporary, un-adjudicated, or blocked federal freezes from its primary baseline deficit projections.
My next post, under the “Commentary” category, will examine perspectives from both sides on California’s budget growth: what the budget funds, what it omits or underfunds, and whether Californians received the promised results.
Sources
- State Expenditure Data: Sourced from the California Department of Finance (DOF), specifically their Historical Budget Information series and Summary Schedules. These records compile actual audited expenditures for past fiscal years and enacted figures for the current cycle.
- Population Figures: Sourced from the U.S. Census Bureau (Annual Estimates of the Resident Population) and cross-referenced with demographic data from the California Department of Finance’s Demographic Research Unit.
- Inflation Adjustments: Calculated using the U.S. Bureau of Labor Statistics (BLS) Consumer Price Index for All Urban Consumers (CPI-U), normalizing all historical dollar amounts to constant 2026 purchasing power.
- California Budget & Policy Center
- Guide to California State Budget Process
- Legislative Analyst’s Office (LAO)
- Federal Accountability – California Department of Justice
- HHS.gov
Leave a Reply