Category: Data Analysis and Insights

  • California Education Budget Breakdown

    The following pages examine California’s K–12 education budget, one of the state’s three largest spending categories at $149.1 billion. This overview explains where the money goes, how California students perform, and how the state compares with Texas, which has a similar population and demographic profile but approaches funding in a very different way.

    First, here is a breakdown of California’s education budget:

    California’s total TK–12 education budget is $149.1 billion from state, local, and federal sources. At its core is the state’s Proposition 98 guarantee, which directs $128 billion to public schools and community colleges.

    Because school spending is largely shaped by fixed operating costs, staffing, and state mandates, California’s education budget falls into the following major categories:

    1. Core General Operations: The LCFF ($110+ Billion)

    About 75% to 80% of California’s education budget flows through the Local Control Funding Formula (LCFF).

    • What it funds: The LCFF is the primary operating account for local districts. State law and collective-bargaining agreements direct about 80% to 85% of these funds to employee compensation—teacher salaries and benefits—and fixed facility expenses such as utilities and maintenance.
    • The 2026–27 increase: The budget added $3.3 billion for an enhanced 4.31% cost-of-living adjustment (COLA) to address inflation and higher operating costs.

    2. Categorical Programs & Specialized Direct Support

    Beyond general funding, billions are reserved for programs serving specific students, infrastructure needs, and workforce development:

    • Special Education ($2.4 billion ongoing increase): The state raised the base rate to $1,340 per student, helping districts cover the high cost of services for students with low-incidence disabilities.
    • Discretionary Block Grants ($2.8 to $5 billion): Districts receive about $937 per student with few restrictions, giving local boards flexibility to address budget shortfalls.
    • Community Schools Partnership Program ($1 billion ongoing): This initiative turns traditional campuses into hubs for wraparound social services, family support, and mental-health services.
    • Educator Workforce Support ($678 million one-time): Funding supports teacher pipelines, including $408 million for student-teacher stipends, $250 million for Teacher Residency Grants, and credential pathways intended to ease teacher shortages.
    • Universal Transitional Kindergarten and After-School Expansion ($2+ billion): Ongoing funding supports free TK for all four-year-olds and expanded after-school and summer programs.
    • Kitchen Infrastructure and Nutrition Services ($500 million one-time): Grants help schools upgrade kitchens to support free meals for all students.

    To show how the $149.1 billion funding package reaches students, the money can be traced through three financial layers.

    These layers operate in the following order:

    Layer 1: Your Local District Per-Pupil Share

    Across all funding sources, California provides an average of $27,418 per student. The Proposition 98 guarantee—the primary pool of state and local tax revenue—provides $20,427 per student.

    Because California uses a weighted equity model, per-pupil funding varies by district.

    • The Base Factor: Each district begins with a Grade Span Base Grant based on Average Daily Attendance (ADA). For the current year, these grants include a 4.31% COLA.
    • The Local Effect: Lower-poverty suburban districts generally receive amounts near the base level. Districts with larger shares of high-needs students receive more through equity-based multipliers.

    Layer 2: The Proposition 98 Reserve Fund (The State’s Shield)

    Before funds reach local districts, California manages a constitutionally required reserve known as the Proposition 98 Rainy Day Fund.

    • The Balance: The Proposition 98 Reserve holds a record $9.2 billion for the fiscal cycle.
    • The Function: The reserve absorbs revenue swings caused by California’s reliance on volatile capital-gains taxes. The state deposits excess revenue in strong years and draws on the fund during downturns to reduce the risk of midyear district cuts.

    Layer 3: The Local Control Funding Formula (LCFF) Multipliers

    After reserve funds are set aside, the remaining money flows through the Local Control Funding Formula (LCFF), which governs about 60% of California public-school funding.

    The formula has three tiers that direct additional funding according to each district’s student population:

    1. The Base Grant: Every school receives a foundational amount based on grade span: TK–3, 4–6, 7–8, or 9–12.
    2. The Supplemental Grant (+20%): Districts receive 20% above the base grant for each student who is an English learner, foster youth, or low-income.
    3. The Concentration Grant (+65%): When high-needs students exceed 55% of district enrollment, the district receives an additional 65% of the base grant for each student above that threshold.

    This structure combines a $9.2 billion statewide reserve with LCFF multipliers that direct more funding to high-poverty districts than to lower-needs suburban districts.

    About the $9.2 Billion Reserve Fund

    Is the $9.2 billion held entirely as cash?

    The reserve is real, but the state can temporarily use its cash through internal borrowing.

    Under this budget mechanism, the balance remains recorded on paper while cash may be temporarily used to pay other state obligations.

    The following explains how this arrangement works:

    1. The Legerdemain: Internal Cash Flow Borrowing

    The California Constitution places the Public School System Stabilization Account, or Proposition 98 Reserve, within the state’s General Fund.

    Because the reserve is part of the General Fund, the State Controller may temporarily use unneeded balances to cover daily cash-flow shortages.

    • The Reality: When capital-gains revenue rises, the state records a deposit to the school reserve. The Controller may then temporarily use that cash to pay other obligations before later tax receipts arrive.
    • Why the balance remains valid: The transaction functions as an interest-free internal loan. The state must restore the school account when revenue arrives.

    2. The “Settle-Up” Maneuver

    This practice has fueled a political dispute among Governor Gavin Newsom, the nonpartisan Legislative Analyst’s Office (LAO), and teachers’ unions after the state expanded its use of delayed payments.

    To balance the $128 billion K–12 budget, the state funded the calculated Proposition 98 minimum guarantee $3.9 billion below the required level.

    • The Maneuver: The state recorded the $3.9 billion as a future “settle-up” obligation rather than paying it immediately, deferring payment until later fiscal years.
    • The Result: Deferring the payment allows the state to report a balanced budget now. Teachers’ unions argue that the delay is an unconstitutional maneuver that conceals structural deficits.

    The state cannot permanently redirect education funding without a two-thirds vote to suspend Proposition 98. However, it can use the reserve for short-term cash management. The full balance remains on the books even when the immediately available cash is lower.

    This is how California allocates the $149.1 billion K–12 budget; it does not represent the state’s total spending on all forms of education.

    A tale of two states: Texas and California

    The data provides a clear comparison between the two states.

    Texas serves nearly as many students as California with a smaller total budget.

    • Total budgets: Texas spends $104.9 billion to educate 5.5 million students, while California spends $149.1 billion for 5.8 million.

    1. California K-12 Performance (Ranked #31)

    California faces foundational resource challenges that weigh on statewide performance.

    • Strengths: California provides strong pre-K access and ranks highly in the share of students who take and pass AP exams.
    • Challenges: California has one of the nation’s highest student-to-teacher ratios, averaging more than 22 students per teacher. Its fourth- and eighth-grade NAEP reading and math scores trail national benchmarks.

    2. Texas K-12 Performance (Ranked #32)

    Texas uses a different education structure, producing a distinct mix of strengths and weaknesses.

    • Strengths: Texas has a substantially higher high-school graduation rate—89%, near the top five nationally—and a lower student-to-teacher ratio of about 14 to 1.
    • Challenges: Texas still ranks poorly in overall school quality. Teacher shortages, funding below northeastern-state levels, and inequities tied to property taxes leave many rural and urban schools below reading and math benchmarks.

    The Cost-of-Living Equalizer (Purchasing Power)

    • California spends $27,418 per student, compared with $18,972 in Texas. After adjusting for regional costs and purchasing power, however, the resources those amounts buy are nearly equivalent.
    • Labor Costs: California’s high cost of living drives up teacher salaries, housing-related compensation pressures, and pension obligations.
    • Operating Costs: Texas’s lower cost of living means each dollar buys more space, utilities, and local services.
    • Bottom Line: California’s roughly $27,000 buys about the same quantity of staff time, facilities, and services that Texas purchases for roughly $19,000. Much of the nominal gap reflects regional prices and real-estate costs.

    Identical Demographic Baselines

    • Student demographics strongly influence average K–12 performance on national assessments such as NAEP. California and Texas have similar student profiles:
    • Each state serves about 5.5 million to 6 million K–12 students.
    • In both states, roughly 60% or more of students are low-income or economically disadvantaged.
    • Both have among the nation’s largest shares of English learners.
    • Given these similarities, both states rank in the bottom third nationally—31st and 32nd.

    Neither model has broken the longstanding association between concentrated poverty and lower average standardized-test scores.

    California’s frustration is that, despite a 60% increase in per-pupil spending in recent years, average student performance has remained flat or declined slightly.

    • Proficiency Gap: Recent results show that 49.3% of California students are proficient in reading and 38.4% are proficient in math.
    • Decline Since 2018: In 2018, California students averaged 6 points below standard in reading and 36 points below in math. Today, the gaps are about 8 and 42 points, respectively, leaving the state in the bottom third nationally for overall child academic well-being.
    • California leads in one measure: 31.8% of graduating seniors have passed at least one AP exam, compared with 21% in Texas.

    Remediation Rates

    Historically, both California and Texas have had high remediation rates. Longitudinal data found that roughly 50% to 60% of community-college entrants in each state were placed in remedial math or English, indicating inadequate K–12 preparation for college.

    The states now address the problem differently:

    California largely eliminated traditional remediation through legislation, while Texas uses a hybrid corequisite model.

    1. California: The Legislative Remediation Ban

    California responded to high community-college remediation rates by changing placement law.

    • Policy (AB 705 and AB 1705): California barred community colleges from relying on a single placement test to assign most students to noncredit remedial classes. Most students must instead enter transfer-level, credit-bearing courses.
    • Reported Results: Remediation rates fell sharply because most remedial courses disappeared. The share of students completing transfer-level math in their first year more than doubled to over 58%.
    • Tradeoff: The policy moved underprepared students directly into college-level work without first changing K–12 outcomes. More students now pass transfer-level courses, but failure rates increased among the least-prepared students, while second-year persistence fell nearly 7%.

    2. Texas: The Corequisite Strategy

    Texas uses a different framework overseen by the Texas Higher Education Coordinating Board (THECB). Rather than eliminating remediation, the state adopted a required corequisite model.

    • Policy: Students identified as underprepared through high-school records or Texas Success Initiative scores may take a credit-bearing course while also enrolling in a matching support lab.
    • Results: Texas continues to count students who need corequisite support. Although its 89% high-school graduation rate exceeds California’s 82%, nearly half of standard community-college entrants still require additional academic support.

    The Core Takeaway

    • Texas uses TSI testing and state audits to identify students who need support, then tracks them through a structured corequisite system.
    • California largely removed the remedial category through legislation, placing students in college-level courses and leaving faculty to provide needed support.
    • Both states face a K–12 preparation gap between average neighborhood schools and elite schools. Texas reports the gap through testing and corequisite data, while California’s college placement rules reduce the visibility of traditional remediation.

    Administration Bloat Texas and California

    California has sharply expanded its non-teaching workforce; a trend critics call administrative bloat. Texas has followed a similar trajectory.

    From 2020 to 2023, California public-school enrollment fell 5.1%, while districts added 74,428 nonteaching positions.

    California’s 80/20-style budget framework classifies and presents this bureaucracy differently from Texas. Its non-teaching growth falls into several categories:

    The “Community Schools” and Social Service Expansion

    While Texas districts added central-office planners and compliance managers, California expanded programs that critics describe as “mission creep.”

    California invested more than $4 billion in “Community Schools,” which turn traditional campuses into centers for wraparound social services.

    • Jobs Added: The policy increased hiring of coordinators, family liaisons, mental-health counselors, program directors, and intake specialists.
    • Classification: California classifies these positions as “direct student support” and “equity investments.” Under a narrower Texas definition, similar roles may be counted as administrative overhead.

    The Uncertified and Program Management Boom

    California’s administrative workforce has also grown through local program management:

    • Long-Term Shift: Over several decades, California enrollment grew 17%, while administrators and nonteaching support staff increased 46%.
    • Universal Programs: Funding for universal transitional kindergarten and expanded after-school programs also created positions for regional directors, compliance auditors, and program managers who administer state grants rather than teach.

    Texas Education Bloat

    The 34-Year Growth Trajectory (1992–2026)

    Across Texas public schools, staffing growth over this period was heavily concentrated outside the classroom:

    • Student enrollment: Increased 54%.
    • Teaching staff: Increased 73%.
    • Non-teaching staff and administrators: Increased 238%.

    Non-teacher hiring grew four times faster than enrollment, shifting the workforce balance. Today, nonteachers make up 52% of Texas public-school employees.

    The pattern is not limited to the 1990s. Texas Education Agency staff reports show that over a recent 14-year period, administrative positions grew nearly 42%—three times the 13.6% growth in classroom teachers. Non-classroom staffing continued to rise through the present, although the latest 1.4% decline in enrollment has not yet affected the budget.

    The Bottom Line

    The 238% increase reflects 34 years of cumulative growth in Texas education bureaucracy. Governor Greg Abbott cites it in support of a 70–30 classroom spending cap, arguing that the system has shifted from teacher-centered to administration-heavy.

    The Ultimate Contrast: Why Nobody in California is Capping It

    Despite California’s growth in non-teaching staff amid declining enrollment, a comparable spending cap is politically unlikely.

    California’s system gives local institutions broad control:

    • LCFF Flexibility: The Local Control Funding Formula gives local boards broad spending authority and does not impose statewide classroom-to-overhead ratios.
    • Political Opposition: Teachers’ unions and school-board associations often oppose spending caps or audits as threats to education funding, making central-office reductions difficult.

    Ultimately, both California and Texas have expanded noninstructional overhead while enrollment declined.

    The difference is largely in presentation. Texas describes its approach as accountability and is pursuing legislation to reduce administrative spending. California describes comparable services as wraparound equity support and continues to fund them through new revenue measures.

    This concludes my overview of California’s education budget. A follow-up post will offer commentary; Real Decisions Network maintains a strict policy of separating factual reporting from opinion.

    Sources

    Legislative Analyst Office (LAO)

    Raise Your Hand Texas

    Association of California School Administrators

    California Teachers Association

    Texas Public Policy Foundation

    Texas A&M University

    Audacy

    California Senate Republicans

    California State Portal CA.gov

    California Budget and Policy Center

    CALRTA.org

    Senate Budget and Fiscal Review

    California Budget.gov

    California Competes

    TEA Texas Education Agency

    www.gregabbott.com

    College Board Research

    reason Foundation

    California Department of Education

    Longview News Journal

    American Enterprise Institute – AEI

    Forbes

    CalMatters

    Google AI
  • California Budget Review

    California’s Budget

    California and more specifically its growing government budget has been in the news frequently of late and I thought I would just dig into the numbers presenting them factually without the commentary. California is not being singled out for criticism; as the world’s fourth-largest economy with substantial resources, it provides a useful starting point for examining state budgets and how public funds are allocated.

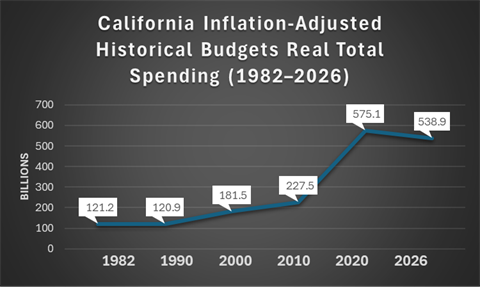
    We’ll start with the overall budget growth chart shown in inflation-adjusted dollars. Followed by a breakdown of the 2026-27 budget totals.

    Breakdown of the $538.9 Billion Total (2026–27)

    Budget LayerAmount (Billions)What It Covers
    State General Fund$251.5BThe core operating budget (Income/Sales tax revenue)
    State Special Funds$95.2BEarmarked money (e.g., DMV fees, gas taxes for roads)
    State Bond Funds$5.0BBorrowed money for long-term infrastructure
    State-Level Total$351.7BThis is the official Enacted Budget figure.
    Federal Funds$187.2BFederal matching dollars (mostly for Medi-Cal)
    Grand Total Spending$538.9BThis is the comprehensive historical trend figure.
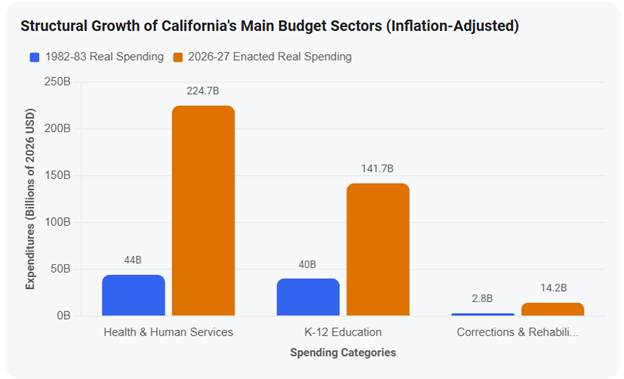
    • Health Care (The #1 Driver): Health and Human Services has expanded almost 5x in real terms. This massive expansion is fueled by the explosive growth of Medi-Cal (California’s version of Medicaid). In 1985, roughly 1 in 10 Californians were on Medi-Cal; today, following the federal Affordable Care Act expansion and subsequent state-level eligibility additions (such as extending coverage to undocumented residents), it covers over 13 to 14 million people—more than one-third of the entire state populace. Total annual Medi-Cal costs alone now hover around $219.7 billion.
    • TK-12 Education (The Protected Baseline): By law, K-12 education is shielded by Proposition 98, a voter-approved initiative passed in 1988 that requires roughly 40% of the state’s General Fund to be dedicated to schools. As state tax revenues skyrocketed over the decades, the Proposition 98 guarantee grew proportionally, bringing real TK-12 education spending from roughly $40 billion in 1982 to over $141 billion today. Spending per single student now sits at an all-time high of $21,129 per year.
    • Corrections & Rehabilitation: There is a common misconception that prisons are a major contributor to the state’s recent budget crises. During the “tough-on-crime” era of 1980 to 2006, California’s prison budget did skyrocket as the incarcerated population soared past 160,000. However, following federal court mandates to reduce overcrowding, the prison population has fallen below 95,000. While the Department of Corrections (CDCR) budget stands at $14.2 billion for 2026–27, it now accounts for less than 4.1% of total state spending.

    When evaluating California’s long-term spending surge in real, inflation-adjusted terms, Health and Human Services has been the overwhelming driver of expansion, followed closely by TK-12 Education. Conversely, while prison spending grew rapidly in the 1980s and 1990s, it has flatlined and even shrunk as a percentage of the total budget in recent years.

    Today, roughly 3 out of every 4 dollars the state spends from its general and special funds are consumed by just three categories: health, education, and corrections.

    The chart below displays how these major buckets have scaled up from 1982 to the 2026–27 enacted budget, converted into constant, inflation-adjusted 2026 dollars.

    The chart on page 1 page shows a sharp rise in budget spending from 2010 to 2020 of almost 200 billion dollars. The year-by-year breakdown below identifies the primary driver of each increase, with further detail provided later in the report.

    Breaking down the Budget Spike (2010-2026)

    California State Budget: Total Expenditures (All Funds + Federal Dollars)

    Fiscal YearNominal Total SpendingReal Spending (Adjusted to 2026 Dollars)Key Macro Driver
    2010–11$188.5 Billion$279.0 BillionARRA (Federal Stimulus Act) funds peak to cushion recession gaps.
    2011–12$185.2 Billion$266.7 BillionFederal stimulus winds down; state drops to lowest real spending floor.
    2012–13$205.4 Billion$291.7 BillionEconomic stabilization begins; revenues recover.
    2013–14$215.8 Billion$300.0 BillionInitial Medicaid (Medi-Cal) expansions under the Affordable Care Act.
    2014–15$252.6 Billion$348.6 BillionMassive influx of federal dollars as millions of residents enter Medi-Cal.
    2015–16$265.1 Billion$360.5 BillionContinued structural growth in health, human services, and K-12 education.
    2016–17$280.4 Billion$372.9 BillionSteady multi-year economic expansion phase.
    2017–18$298.5 Billion$388.1 BillionHigh capital gains collections push state funding higher alongside federal match rates.
    2018–19$315.2 Billion$400.3 BillionReaches the $400B threshold in real terms prior to administration transitions.
    2019–20$342.8 Billion$428.5 BillionHistoric pre-pandemic peak across education investments and local aid.
    2020–21$485.5 Billion$592.3 BillionUnprecedented $110B+ nominal spike driven by emergency pandemic response and initial CARES Act/ARP federal inflows.
    2021–22$442.2 Billion$514.8 BillionMassive state revenue surplus (“windfall”) masks tapering federal aid.
    2022–23$413.8 Billion$452.9 BillionPeak tech capital gains push ongoing commitments up right before the market drop.
    2023–24$452.7 Billion$479.5 BillionIncome tax filing delays clash with revenue drop, triggering major structural deficits.
    2024–25$413.8 Billion$426.2 BillionSpending temporarily dips as the state uses reserve funds to cover gaps.
    2025–26$414.1 Billion$419.8 BillionEnacted cuts to baseline state functions while maintaining core safety nets.
    2026–27$539.7 Billion$539.7 BillionRecord High Real Footprint: General Fund grows to $251.5B, masked heavily by complex structural borrowing and internal fund maneuvers.


    Key Drivers of the Budget Spike (listed without ranking by impact)

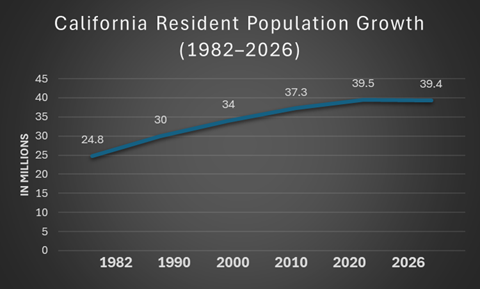
    1. Population Growth: California’s population grew by approximately 60% from 1982 to 2026, but has remained relatively flat since 2010. Population growth alone therefore does not explain the budget increase.

    2. Permanently Expanded Entitlements

    During the flush pandemic years, when California sat on a massive structural surplus, policymakers didn’t just allocate money to temporary relief. They permanently expanded foundational, long-term state programs:

    Universal Medi-Cal: California became the first state to remove all immigration-status barriers for its low-income healthcare program, expanding access to adults aged 26 to 49. This structurally cemented tens of billions in recurring yearly expenditures into the Health & Human Services budget.

    Transitional Kindergarten (TK): The state committed to building out a universal grade level for all four-year-olds, creating a permanent multi-billion-dollar funding obligation for local school districts.

    3. Statutory Funding Formulas (Proposition 98)

    Under California’s constitution, Proposition 98 mandates that a fixed percentage of General Fund revenues must go to K-14 education. Because revenues spiked so high in 2021 and 2022, the statutory minimum funding guarantee for schools locked in at record-high minimum floors. Even when the state faced subsequent deficits, unwinding these constitutionally mandated education outlays proved legally and politically difficult, resulting in the state deferring billions in internal loans rather than slashing school budgets.

    4. Inflation and Cost-of-Living Adjustments

    The same severe inflation that impacted consumer wallets also heavily expanded the state’s cost of doing business. State operational costs—ranging from multi-year infrastructure grants and concrete for transit to statutory cost-of-living adjustments (COLAs) built into public safety nets like CalWORKs—automatically climbed to match economic conditions. Additionally, the state committed to permanent baseline raises for university systems (such as UC and CSU) and state worker contracts to keep pace with the cost of living.

    5. The Illusion of Balances (Budget Maneuvers)

    Because California is constitutionally required to pass a “balanced budget” every year, it couldn’t run a traditional federal-style deficit when the tech boom turned into a revenue bust. Instead of severely cutting the expanded safety nets, the state utilized extensive accounting gimmicks, internal fund shifts, and borrowing against future years to keep the nominal spending baseline elevated. This created what state analysts call a compounding “wall of debt,” maintaining high structural spending despite lower real-time revenues.

    Completing the picture of California’s Budget

    Federal matching funds account for 34.7% of California’s total spending, including more than $187 billion that supports daily state operations. Yet California remains a net donor to the federal government: its residents and businesses pay roughly $275 billion more in federal taxes than the state receives in federal funding.

    This Year’s Federal Funding Problem, Federal Funds Frozen.

    Stripping away the political messaging, the legal filings, administrative notices, and state audit records establish the concrete facts behind why the federal government has frozen or deferred funding to California in 2026.

    The actions trace back to three specific compliance, regulatory, and policy categories:

    1. Commercial Trucker Licensing Dispute (DMV Integration)

    • The Action: The U.S. Department of Transportation (DOT) withheld $160 million in federal highway safety and infrastructure funds from California.
    • The Documented Reason: The Federal Motor Carrier Safety Administration (FMCSA) flagged 17,000 “non-domiciled” commercial driver’s licenses (CDLs) that California had issued to foreign-born drivers, refugees, and asylum seekers. Federal rules require these individuals to possess specific status documentation that the FMCSA stated was missing or invalid.
    • The Trigger: The California DMV agreed to cancel the non-compliant licenses but pushed its internal deadline back by two months to complete the process. The federal government rejected the extension and froze the highway funds the day after the state missed the original January 5, 2026, deadline.

    2. High-Risk Medicaid (Medi-Cal) Documentation Audits

    • The Action: The Centers for Medicare & Medicaid Services (CMS) placed a temporary $867.5 million deferral on federal reimbursements to California’s Medicaid system.
    • The Documented Reason: This is a regulatory “deferral,” not a permanent cut. CMS flagged rapid expenditure growth within California’s In-Home Supportive Services (IHSS) program—which provides home-care hours to roughly 900,000 low-income seniors and disabled individuals. Because California’s program growth heavily outpaced national spending trends, CMS designated the claims as “high-risk” under its standard fraud-and-waste mandates, pausing the payments until the state submits itemized billing and eligibility documentation to justify the spike.

    3. Welfare & Child Care System Compliance Checks

    • The Action: The Department of Health and Human Services (HHS) attempted to freeze $5 billion in family assistance grants allocated to California (affecting CalWORKs/TANF, the Child Care and Development Fund, and the Social Services Block Grant).
    • The Documented Reason: HHS cited overarching “program integrity” and systemic fraud concerns within state-administered public welfare programs. To release the funds, the federal government demanded broad, individualized data tracking of program recipients to audit compliance.
    • The Legal Status: A federal judge issued an injunction blocking this specific freeze. The court ruled that the federal government bypassed the legally required administrative processes and failed to provide sufficient evidence of widespread fraud to justify cutting off the funds. Data reviewed during the case showed that the vast majority of flagged welfare losses (such as EBT skimming) involved state and local funds rather than federal dollars.

    4. Housing & Climate Grants Policy Adjustments

    • The Action: Shifting federal guidelines slowed down hundreds of millions in expected funding for homelessness programs and green energy infrastructure.
    • The Documented Reason:
    • Homelessness (HUD): The Department of Housing and Urban Development adjusted its funding criteria for the Continuum of Care program. The new rules limit funding for permanent housing projects and redirect resources toward temporary shelters and sober-living programs, making California’s permanent-housing-first model ineligible for certain grants.
    • Electric Vehicles (FHWA): The Federal Highway Administration restricted roughly $300 million in pre-approved funding meant for electric vehicle charging networks, shifting priorities under modified federal energy directives.

    California’s Budget Report

    This completes my attempt to provide a broad picture of California’s budget, its major programs, and the reasons spending rose rapidly over 16 years despite comparatively modest population growth. The state’s spending and budget decisions provide a clear view of its priorities. Regardless of one’s view of the policies and laws behind the budget’s growth, the figures offer a factual basis for evaluating them. The report concludes with a summary from the Legislative Analyst’s Office (LAO) budget findings.

    Summarizing California’s Budget: Legislative Analyst’s Office (LAO) findings:

    1. A Compounding “Budget Problem”

    • The Deficit Estimate: The LAO calculates an $18 billion budget problem for the fiscal year. This is $5 billion larger than the shortfall anticipated by Governor Newsom’s administration.
    • The Outyear Warning: Looking past the immediate horizon, the LAO projects that structural deficits will climb to roughly $35 billion annually starting in FY 2027–28. This is driven by an ongoing macroeconomic reality: state spending obligations are structurally outstripping baseline revenue growth.

    2. The Illusion of Higher Revenues

    On paper, California has seen strong personal income tax collections growing at The Formula Trap: Under California law, a massive chunk of any new revenue is immediately eaten up by constitutional minimum funding guarantees under Proposition 98 (K-14 school funding) and Proposition 2 (mandatory reserve deposits and debt pay-downs).

    • The AI Bubble Risk: The LAO explicitly warns that the state’s current cash position is heavily inflated by stock market exuberance surrounding Artificial Intelligence (AI). The office advises lawmakers not to build ongoing permanent programs around this trend, noting that tech-heavy capital gains are historically volatile and highly prone to sharp market downturns.

    3. The 70% Core Cost Problem

    • In a public briefing regarding why the state is constantly forcing budget corrections despite high revenue, the LAO noted that roughly 70% of the General Fund growth is driven entirely by sustaining existing, previously made commitments. The structural cost of running expanded healthcare (Medi-Cal), social safety net infrastructure, and automatic cost-of-living adjustments limits the state’s flexibility to cut back when the economy cools down.

    4. Over-Reliance on Internal Cash Borrowing

    The LAO published a major critique titled “Understanding The State’s Astonishing Cash Position,” examining how California built a borrowable cash balance of over $100 billion.

    • The Good News: Because the state has so much cash on hand internally, it has avoided needing to issue short-term Revenue Anticipation Notes (RANs) to Wall Street to pay its daily bills since 2011.
    • The Bad News: The LAO warns that using this cash to essentially mask structural deficits via complex internal borrowing maneuvers carries serious long-term risks if a true economic recession hits.

    Summary Advice to Lawmakers

    The LAO is strongly advising the Legislature to adopt a defensive fiscal stance. They have pushed for the state to implement more than $10 billion in direct budget cuts or net revenue increases and to route cash into less flexible, dedicated rainy-day funds rather than relying on creative internal financing to balance the ledger.

    Note: The LAO deliberately excludes temporary, un-adjudicated, or blocked federal freezes from its primary baseline deficit projections.

    My next post, under the “Commentary” category, will examine perspectives from both sides on California’s budget growth: what the budget funds, what it omits or underfunds, and whether Californians received the promised results.

    Sources

    • State Expenditure Data: Sourced from the California Department of Finance (DOF), specifically their Historical Budget Information series and Summary Schedules. These records compile actual audited expenditures for past fiscal years and enacted figures for the current cycle.
    • Population Figures: Sourced from the U.S. Census Bureau (Annual Estimates of the Resident Population) and cross-referenced with demographic data from the California Department of Finance’s Demographic Research Unit.
    • Inflation Adjustments: Calculated using the U.S. Bureau of Labor Statistics (BLS) Consumer Price Index for All Urban Consumers (CPI-U), normalizing all historical dollar amounts to constant 2026 purchasing power.
    • California Budget & Policy Center
    • Guide to California State Budget Process
    • Legislative Analyst’s Office (LAO)
    • Federal Accountability – California Department of Justice
    • HHS.gov